flowchart LR
  T("`**T**arget cells`") --> X[infection]
  V("`**V**irus`") --> X
  X --> I("`**I**nfected cells`")
  classDef transition fill:#53b6b2,color:#fff
  class X transition
Why build a categorical model?
Topos Oxford Seminar
Tim Hosgood
2026-03-12
What are we going to do?
Context
In January, Nina Fefferman, Mary Lou Zeeman, and myself, supported by the Center for Analysis and Prediction of Pandemic Expansion and the American Institute of Mathematics, organised a workshop:
Theses
- Building a formal categorical model is useful and also complex
- Building a formal categorical model is made considerably easier with the right tools
Questions
How can formal categorical modelling help people to better understand scientific models outside their expertise?
What do we mean when we say things like “categorical modelling can help make assumptions explicit”?
How can we allow for somewhat informal-looking diagrams to convey precise quantitative information?
How can software support the process of building categorical models?
What does it look like, in practice, to add new functionality to CatColab?
The model
A. Hoyer-Leitzel, S.M. Iams, A.J. Haslam-Hyde, M.L. Zeeman, N.H. Fefferman, “An immuno-epidemiological model for transient immune protection: A case study for viral respiratory infections”. Infectious Disease Modelling 8 (2023), pp. 855–864. DOI: 10.1016/j.idm.2023.07.004
- System of ODEs
- Parameter table
- Informal diagram
1. System of ODEs
\left\{ \begin{aligned} \dot{V} &= pI - cV - \mu VA - \beta VT \\\dot{T} &= gT\left( 1-\frac{T+I}{C_T} \right) - \beta' VT \\\dot{I} &= \beta' VT - \delta I - \kappa IF \\\dot{F} &= qI - dF \\\dot{B} &= m_1 V(1-B) - m_2 B \\\dot{A} &= m_3 B - rA - \mu' VA \end{aligned} \right.
2. Parameter table
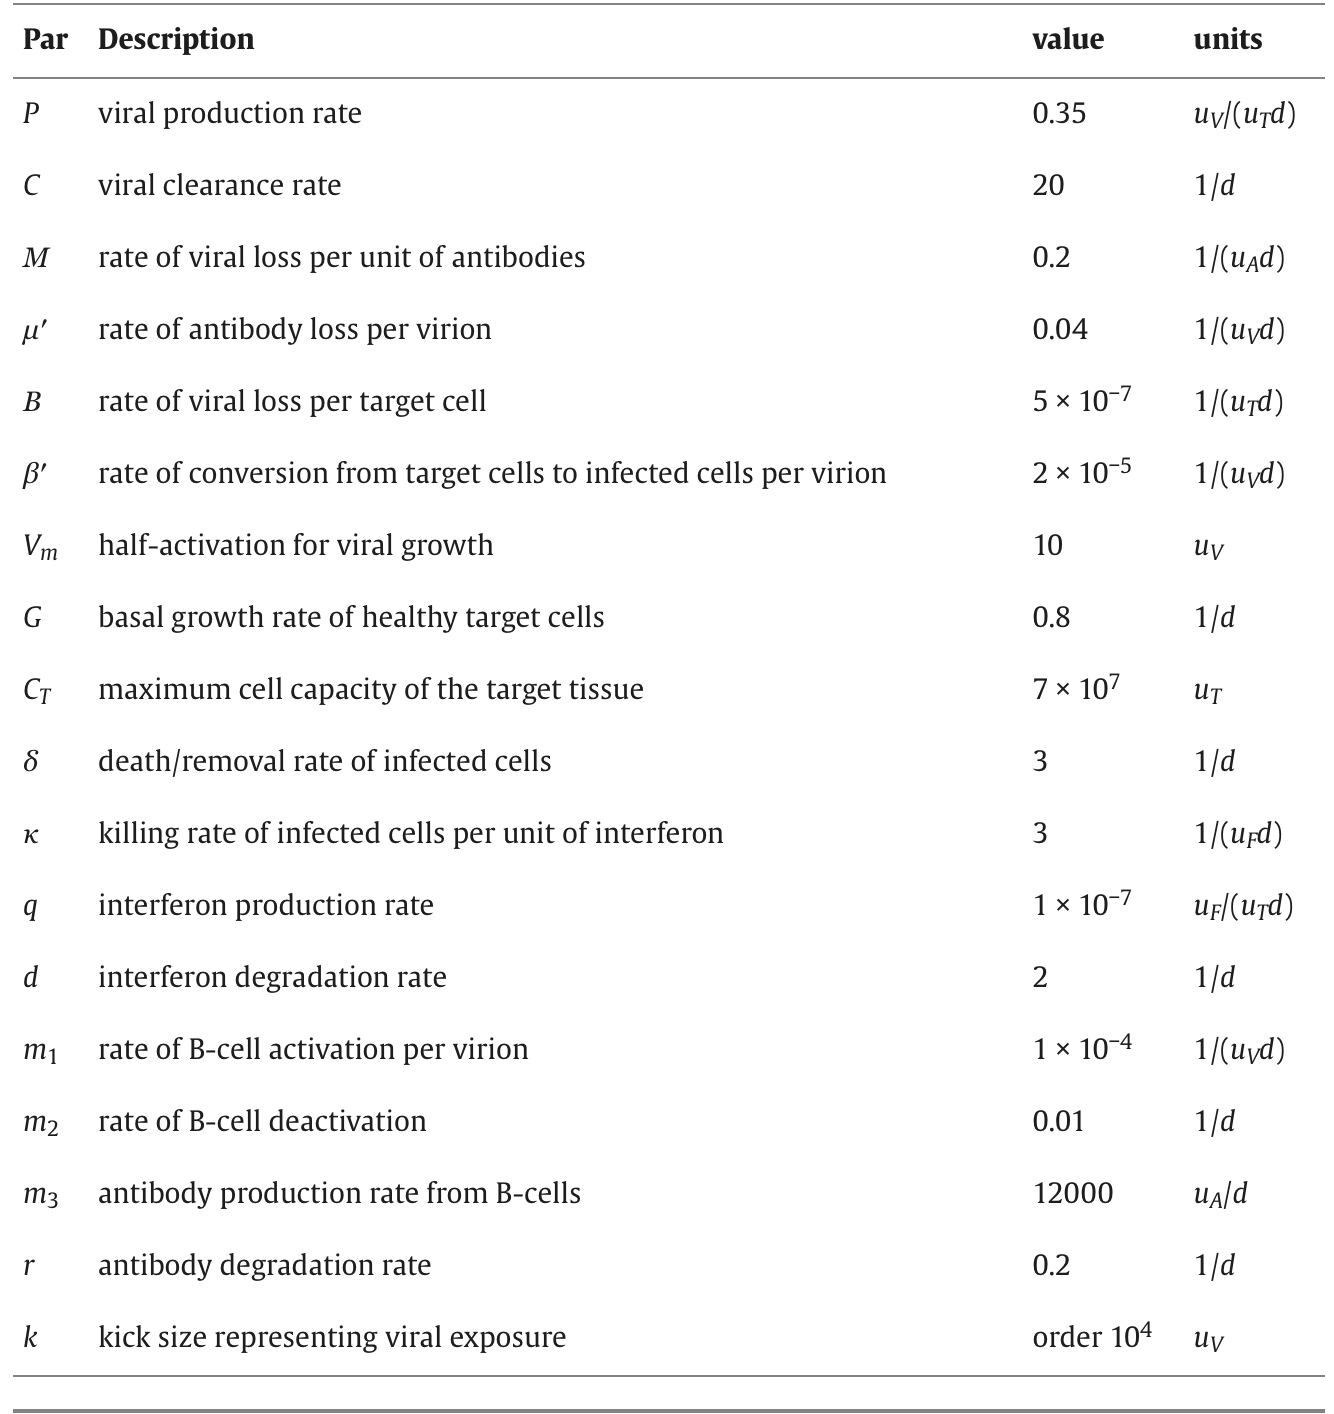
The table of parameters
3. Diagram
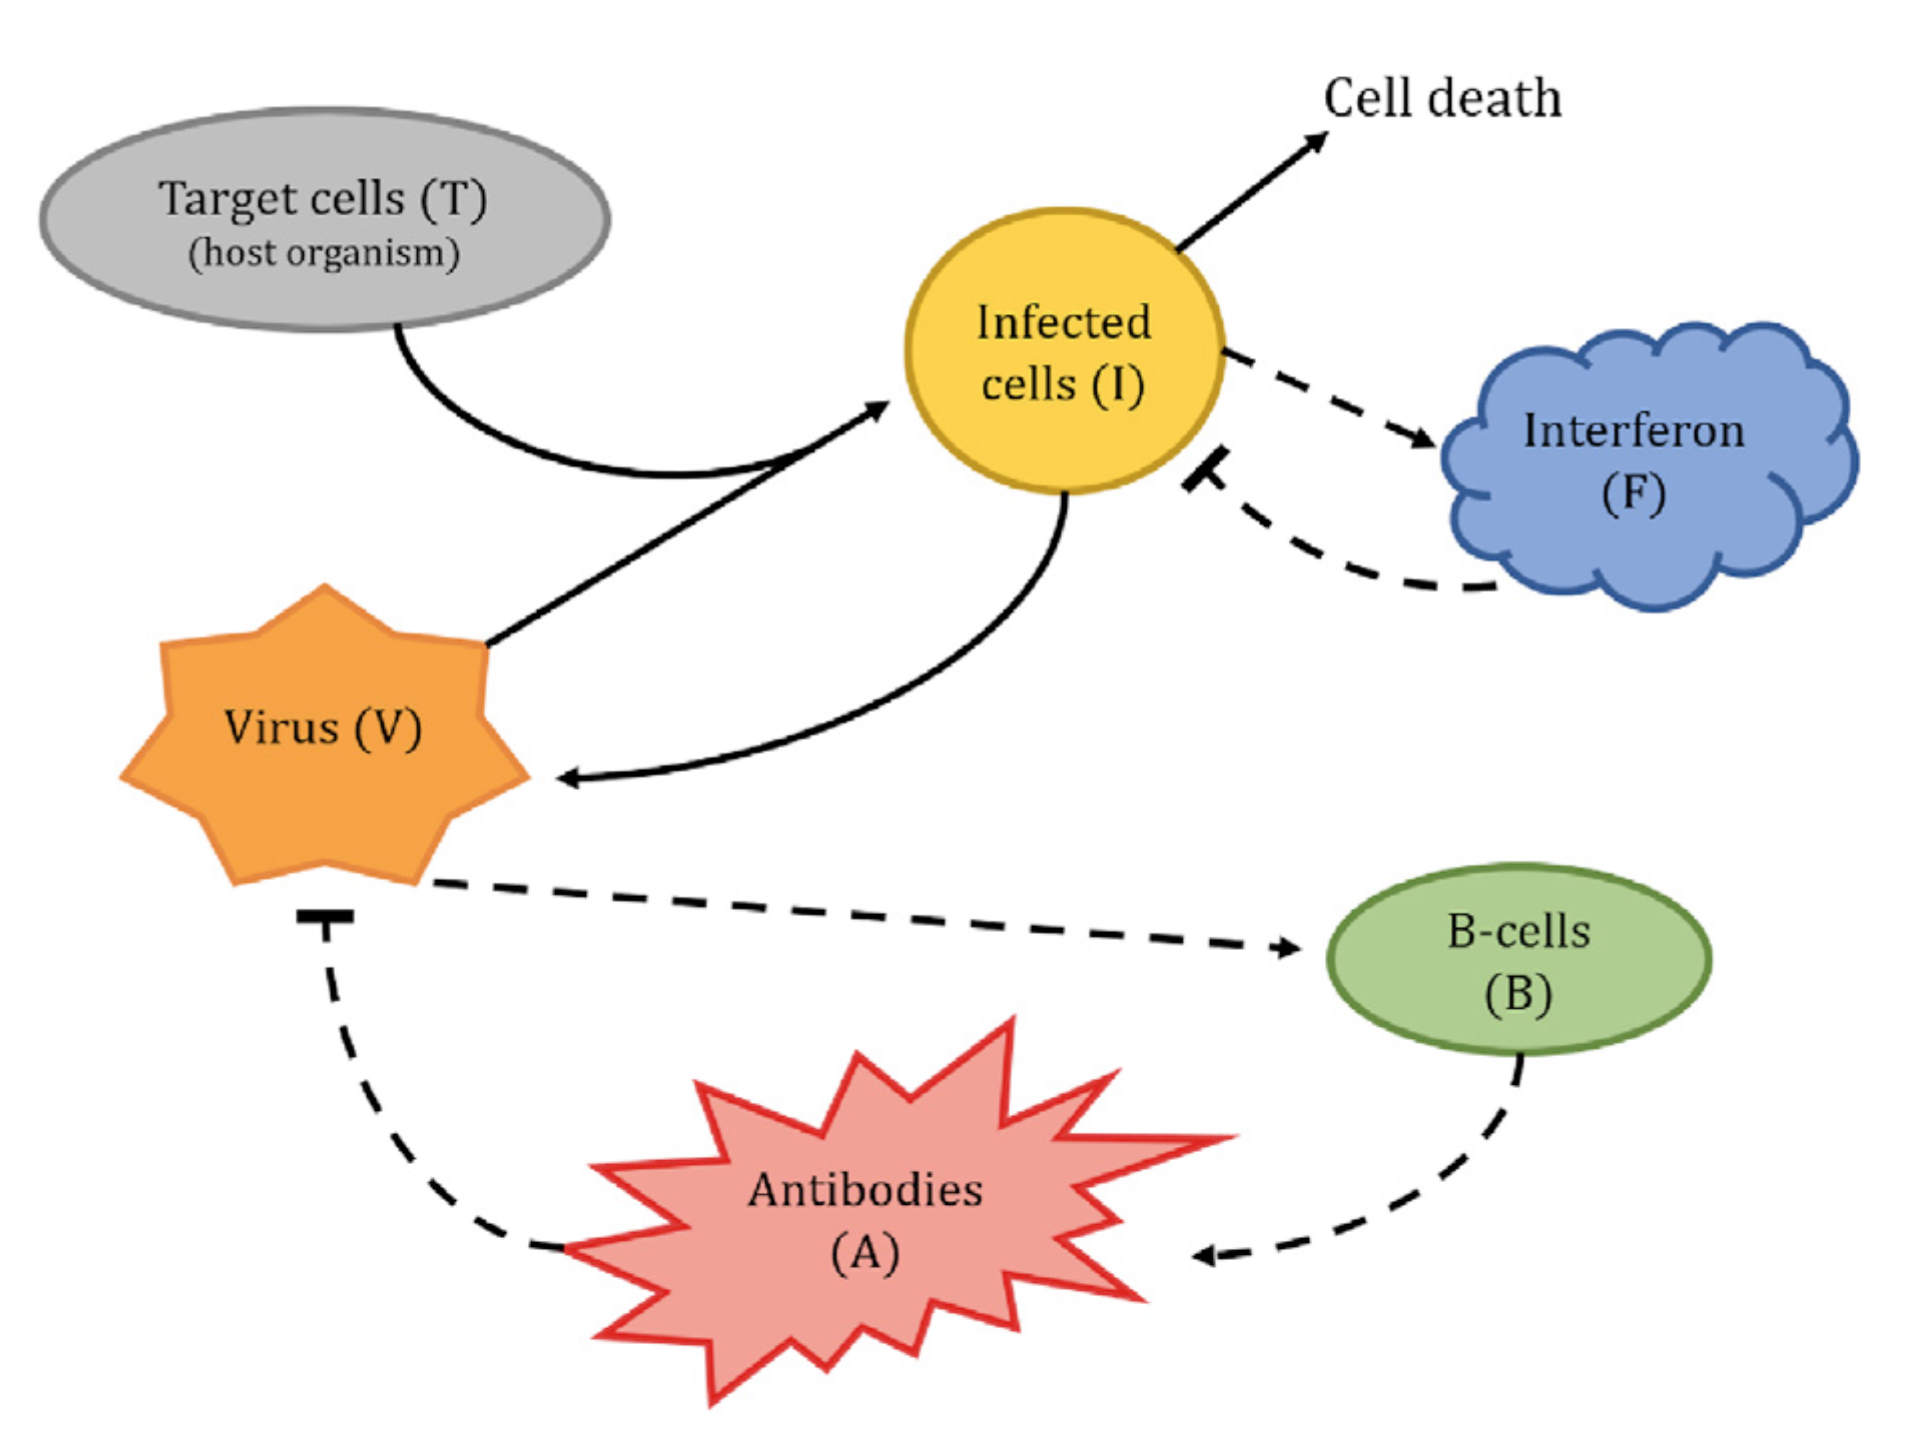
An informal representation of the model
The exercise
We’re going to try to rebuild the model and explain it back, constructing a formal mathematical artefact that can be used to centre a discussion.
Then people can point at specific things that we say and respond with “this sounds wrong” or “this seems right”.
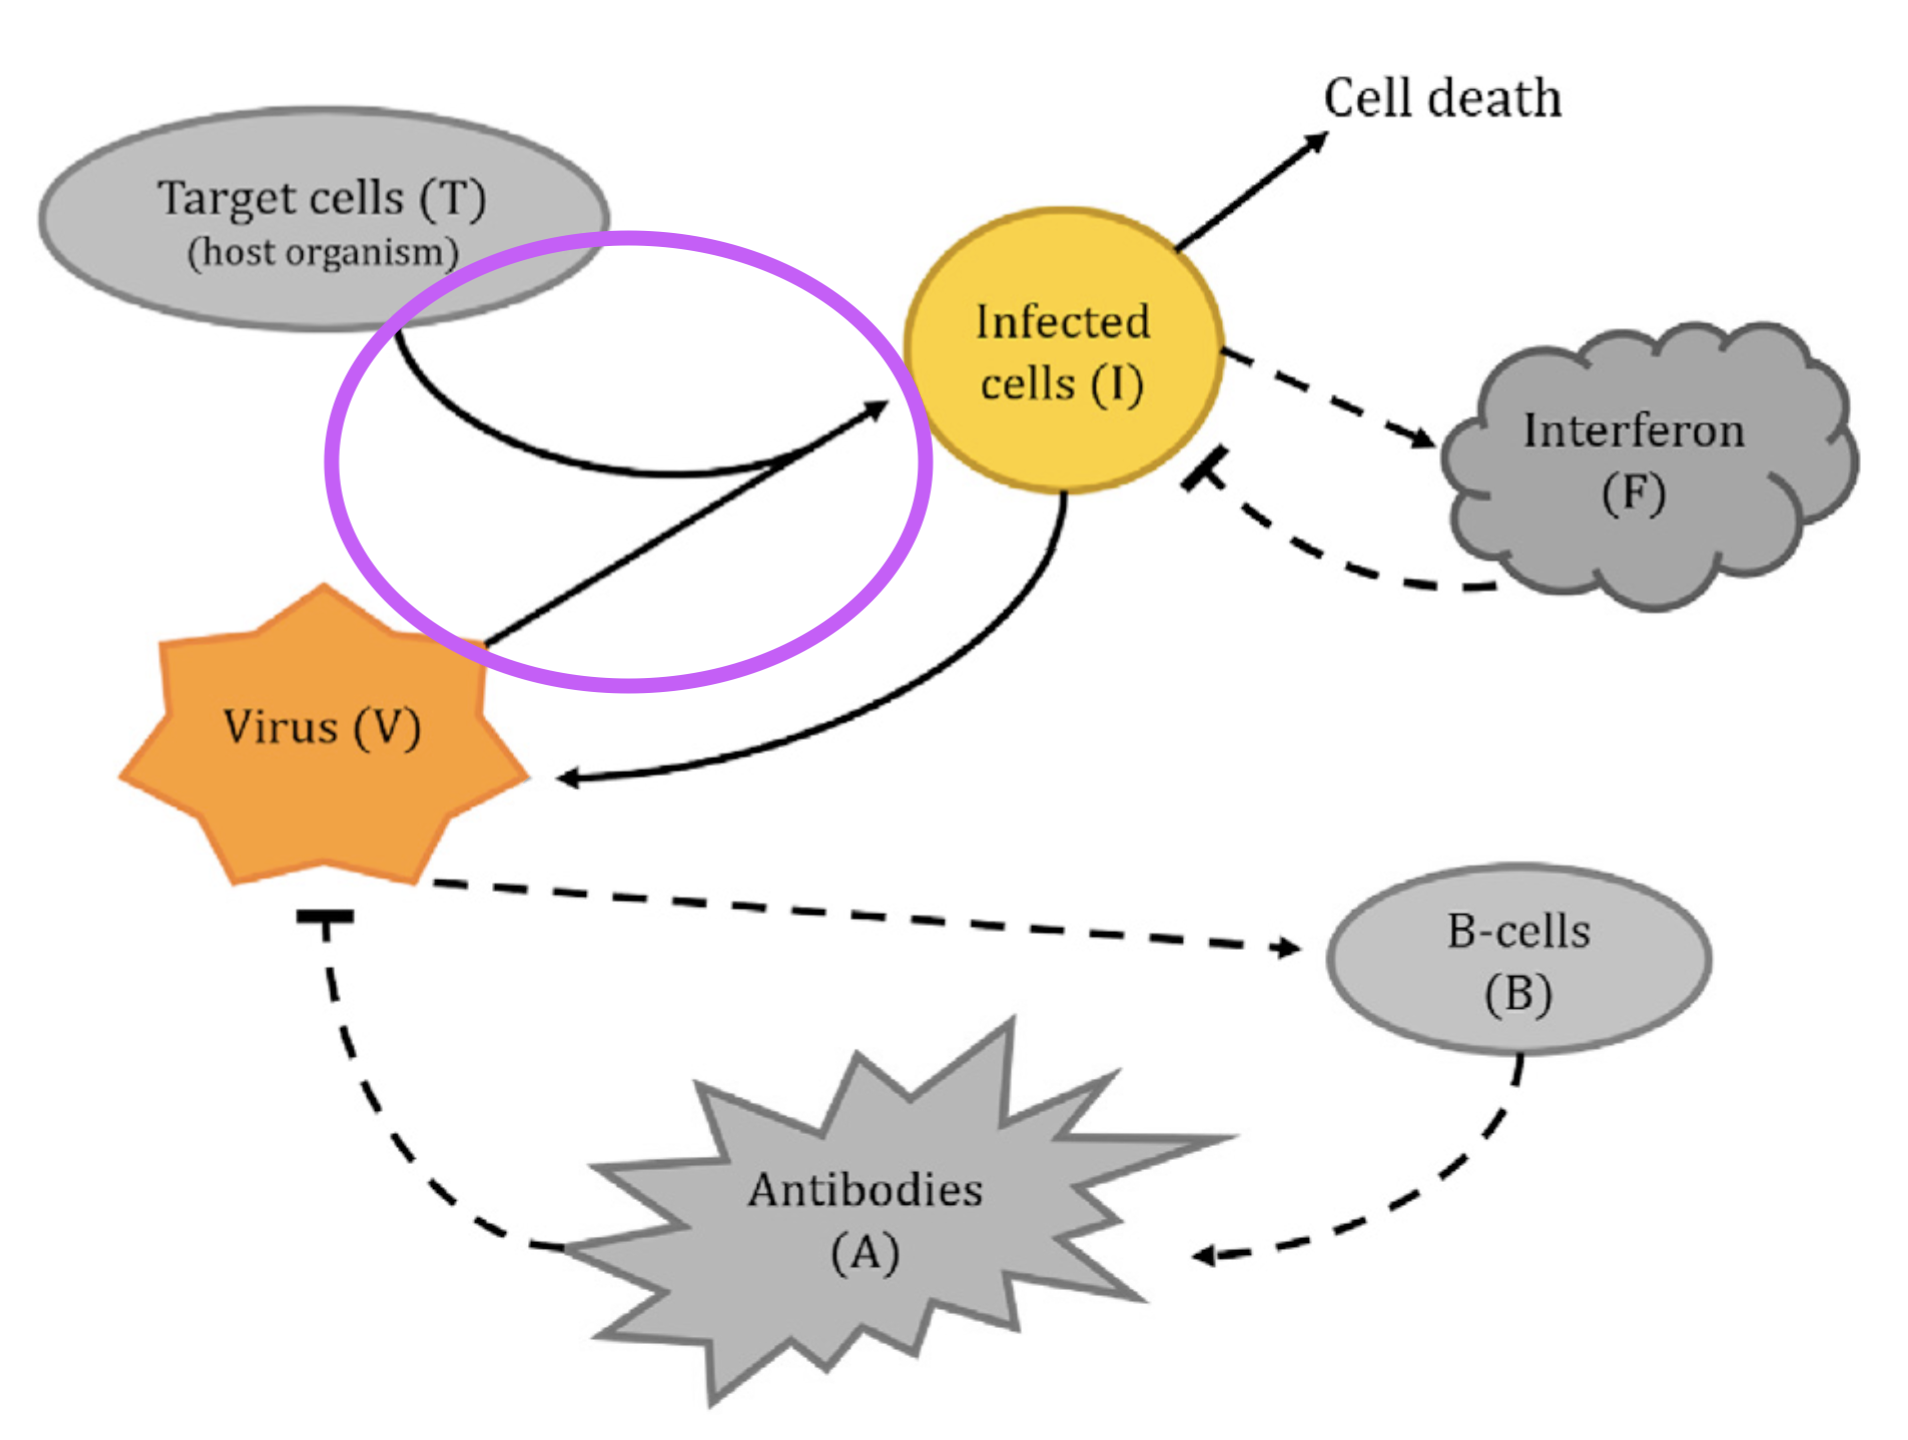
Doing the exercise
Infection
\left\{ \begin{aligned} \dot{V} &= pI - cV - \mu VA - \boxed{\color{purple}\beta VT} \\\dot{T} &= gT\left( 1-\frac{T+I}{C_T} \right) - \boxed{\color{purple}\beta' VT} \\\dot{I} &= \boxed{\color{purple}\beta' VT} - \delta I - \kappa IF \\\dot{F} &= qI - dF \\\dot{B} &= m_1 V(1-B) - m_2 B \\\dot{A} &= m_3 B - rA - \mu' VA \end{aligned} \right.
\left\{ \begin{aligned} \dot{V} &\overset{+}{=} VT \\\dot{T} &\overset{+}{=} VT \\\dot{I} &\overset{-}{=} VT \end{aligned} \right.
\left\{ \begin{aligned} \dot{V} &\overset{+}{=} \beta VT \\\dot{T} &\overset{+}{=} \beta'VT \\\dot{I} &\overset{-}{=} \beta'VT \end{aligned} \right.
flowchart LR
  T("`**T**arget cells`") -->|𝛽'| X[infection]
  V("`**V**irus`") -->|𝛽| X
  X -->|𝛽'| I("`**I**nfected cells`")
  classDef transition fill:#53b6b2,color:#fff
  class X transition
Assumption made explicit
Every interaction corresponds to a specific monomial, which gives a contribution to the ODEs governing both the inputs and outputs.
The coefficients of these contributions are specific to each input and output of the interaction, rather than being determined by just the interaction itself. In other words, every interaction is “mass-conserving up to a constant”.
Clouds and no links
\left\{ \begin{aligned} \dot{V} &\overset{-}{=} \mu VA \\\dot{A} &\overset{-}{=} \mu'VA \end{aligned} \right.
flowchart LR
  T("`**T**arget cells`") -->|𝛽'| X[infection]
  V("`**V**irus`") -->|𝛽| X
  X -->|𝛽'| I("`**I**nfected cells`")
  V -->|𝜇| Y{{antibody-virion binding}}
  A("`**A**ntibodies`") -->|𝜇'| Y
  classDef transition fill:#53b6b2,color:#fff
  classDef death fill:#ddd,color:#555
  class X transition
  class Y death
\left\{ \begin{aligned} \dot{I} &\overset{-}{=} \kappa IF \\\dot{F} &\overset{+}{=} qI \\\dot{F} &\overset{-}{=} dF \end{aligned} \right.
flowchart TB
  I("`**I**nfected cells`")
  F("`Inter**f**erons`")
  X{{I-F interaction}}
  Y[interferon production]
  Z{{interferon degradation}}
  I -->|𝜅| X
  F -->|0| X
  I -->|0| Y
  Y -->|𝑞| F
  F -->|𝑑| Z
  classDef transition fill:#53b6b2,color:#fff
  classDef death fill:#ddd,color:#555
  class X death
  class Y transition
  class Z death
Assumption made explicit
We are not distinguishing between “zero-consumption” and “parametrised-rate” interactions.
Merging or separating interactions
\left\{ \begin{aligned} \dot{V} &\overset{+}{=} pI \\\dot{I} &\overset{-}{=} \delta I \\\dot{F} &\overset{+}{=} qI. \end{aligned} \right.
flowchart LR
  V("`**V**irus`")
  I("`**I**nfected cells`")
  F("`Inter**f**erons`")
  X[1]
  I -->|𝛿| X
  X -->|𝑝| V
  X -->|𝑞| F
  classDef transition fill:#53b6b2,color:#fff
  class X transition
\boxed{?}
\left\{ \begin{aligned} \dot{V} &\overset{+}{=} pI \\\dot{I} &\overset{-}{=} \delta I \\\dot{F} &\overset{+}{=} qI. \end{aligned} \right.
flowchart LR
  V("`**V**irus`")
  I("`**I**nfected cells`")
  F("`Inter**f**erons`")
  X[1]
  I -->|𝛿| X
  X -->|𝑝| V
  X -->|𝑞| F
  classDef transition fill:#53b6b2,color:#fff
  class X transition
flowchart LR
  V("`**V**irus`")
  I("`**I**nfected cells`")
  F("`Inter**f**erons`")
  X{{2a}}
  Y[2b]
  I -->|𝛿| X
  I -.-> Y
  Y -->|𝑝| F
  Y -->|𝑞| V
  classDef transition fill:#53b6b2,color:#fff
  classDef death fill:#ddd,color:#555
  class X death
  class Y transition
flowchart LR
  V("`**V**irus`")
  I("`**I**nfected cells`")
  F("`Inter**f**erons`")
  X{{3a}}
  Y[3b]
  Z[3c]
  I -->|𝛿| X
  I -.-> Y
  I -.-> Z
  Y -->|𝑝| F
  Z -->|𝑞| V
  classDef transition fill:#53b6b2,color:#fff
  classDef death fill:#ddd,color:#555
  class X death
  class Y transition
  class Z transition
Assumption made explicit
We don’t have to group together all contributions with the same monomial form. In fact only do so when we want to suggest that these contributions arise from the same interaction or process or physical phenomenon or …
Regaining flexibility
flowchart LR
  subgraph source
    direction LR
    I1("`**I**nfected cells`")
    V1("`**V**irus`")
    F1("`Inter**f**erons`")
    X1{{3a}}
    Y1[3b]
    Z1[3c]
    I1 -->|𝛿| X1
    I1 -.-> Y1
    I1 -.-> Z1
    Y1 -->|𝑝| F1
    Z1 -->|𝑞| V1
  end
  subgraph target
    direction LR
    V2("`**V**irus`")
    I2("`**I**nfected cells`")
    F2("`Inter**f**erons`")
    X2{{2a}}
    Y2[2b]
    I2 -->|𝛿| X2
    I2 -.-> Y2
    Y2 -->|𝑝| F2
    Y2 -->|𝑞| V2
  end
  source --> target
  classDef transition fill:#53b6b2,color:#fff
  classDef death fill:#ddd,color:#555
  class X1 death
  class Y1 transition
  class Z1 transition
  class X2 death
  class Y2 transition
  classDef box fill:#fff,stroke:#555,opacity:0.5,color:#000
  class source box
  class target box
Future topics
By studying the category (as opposed to the mere set) of these categorical objects, we gain the ability to express how different assumptions relate to one another.
The importance of brackets
\dot{B} = m_1V(1-B) \tag{$\dagger$} \dot{B} = m_1V - m_1VB \tag{$\ddagger$}
\dot{B} = m_1V(1-B)
flowchart TB
  subgraph dagger ["Diagram (†)"]
    direction LR
    V("`**V**irus`")
    B("`**B**-cells`")
    X[X]
    V -.-> X
    X -->|"𝑚₁(1-𝐵)"| B
  end
  classDef transition fill:#53b6b2
  class X transition
  classDef box fill:#fff,stroke:#555,opacity:0.5,color:#000
  class dagger box
\dot{B} = m_1V - m_1VB
flowchart TB
  subgraph ddagger ["Diagram (‡)"]
    direction LR
    V("`**V**irus`")
    B("`**B**-cells`")
    X[X]
    Y[Y]
    V -.-> X
    X -->|𝑚₁| B
    V -.-> Y
    B -->|𝑚₁| Y
  end
  classDef transition fill:#53b6b2
  class X transition
  class Y transition
  classDef box fill:#fff,stroke:#555,opacity:0.5,color:#000
  class ddagger box
Future topics
Using the theory of graded categories, we can allow for more complex labels on the arrows. Through a sort of DOTS approach to migrations of theories, we could allow different parts of the diagram to follow different labelling rules. Finally, by machine composition, we can substitute parameters for (functions of) state variables.
Assumption made explicit
“Interactions in the diagrams” and “monomials in the system of ODEs” are in a one-to-one correspondence.
Future topics
We can black-box (and un-black-box) parts of a model in a compositional (or “decompositional”) way.
flowchart LR
  V("`**V**irus`")
  subgraph boxed ["V–B interaction"]
    X[X]
    Y[Y]
  end
  B("`**B**-cells`")
  V -.-> X
  X -->|𝑚₁| B
  V -.-> Y
  B -->|𝑚₁| Y
  classDef transition fill:#53b6b2,color:#fff
  class X transition
  class Y transition
  classDef box fill:#fff,stroke:#555,opacity:0.5,color:#000
  class boxed box
flowchart LR
  V("`**V**irus`")
  T["V–B interaction"]
  B("`**B**-cells`")
  V -.-> T
  T --> B
  B --> T
  classDef transition fill:#53b6b2,color:#fff
  class T transition
Our final diagram
We still have some issues… but
flowchart LR
  T("`**T**arget cells`")
  V("`**V**irus`")
  I("`**I**nfected cells`")
  F("`Inter**f**erons`")
  A("`**A**ntibodies`")
  B("`**B**-cells`")
  X0[⚠️ target-cell growth ⚠️]
  X1[infection]
  X2{{interferon interference}}
  X3[virus production]
  X4[interferon production]
  Z3{{F death}}
  Y1[B-cell activation]
  Y2[antibody response]
  Y3[antibody-virion binding]
  Z1{{V death}}
  Z2{{I death}}
  Z4{{A death}}
  Z5{{B death}}
  T --> X0
  I --> X0
  X0 --> T
  T -->|𝛽'| X1
  V -->|𝛽| X1
  X1 -->|𝛽'| I
  I -->|𝜅| X2
  F -.-> X2
  I -.-> X3
  X3 -->|𝑝| V
  I -.-> X4
  X4 -->|𝑞| F
  V -.-> Y1
  Y1 -->|"⚠️ 𝑚₁(1-𝐵) ⚠️"| B
  B -.-> Y2
  Y2 -->|𝑚₃| A
  V -->|𝜇| Y3
  A -->|𝜇'| Y3
  V -->|𝑐| Z1
  I -->|𝛿| Z2
  F -->|𝑑| Z3
  A -->|𝑟| Z4
  B -->|𝑚₂| Z5
  classDef transition fill:#53b6b2,color:#fff
  classDef death fill:#ddd,color:#555
  class X0 transition
  class X1 transition
  class X2 death
  class X3 transition
  class X4 transition
  class Y1 transition
  class Y2 transition
  class Y3 transition
  class Z1 death
  class Z2 death
  class Z3 death
  class Z4 death
  class Z5 death
CatColab?
Mistakes I made
- I write down the equations generated by a part of the diagram and then realise that I’ve drawn an arrow between the wrong boxes, or in the wrong direction, or gotten two parameter labels swapped around, or …
- I count the number of interaction boxes and the number of monomial terms and see they don’t match up, and realise that I’ve missed a term
- I realise that I’ve just made a typo and this has lead to two things being swapped around, or a box called “inteferon” being created alongside one called “interferon”
- I make some mistake in the Mermaid code that means it won’t render
flowchart TB
  T("`**T**arget cells`")
  V("`**V**irus`")
  I("`**I**nfected cells`")
  F("`Inter**f**erons`")
  A("`**A**ntibodies`")
  B("`**B**-cells`")
  X0[⚠️ target-cell growth ⚠️]
  X1[infection]
  X2{{interferon interference}}
  X3[virus production]
  X4[interferon production]
  Z3{{F death}}
  Y1[B-cell activation]
  Y2[antibody response]
  Y3[antibody-virion binding]
  Z1{{V death}}
  Z2{{I death}}
  Z4{{A death}}
  Z5{{B death}}
  T --> X0
  I --> X0
  X0 --> T
  T -->|𝛽'| X1
  V -->|𝛽| X1
  X1 -->|𝛽'| I
  I -->|𝜅| X2
  F -.-> X2
  I -.-> X3
  X3 -->|𝑝| V
  I -.-> X4
  X4 -->|𝑞| F
  V -.-> Y1
  Y1 -->|"⚠️ 𝑚₁(1-𝐵) ⚠️"| B
  B -.-> Y2
  Y2 -->|𝑚₃| A
  V -->|𝜇| Y3
  A -->|𝜇'| Y3
  V -->|𝑐| Z1
  I -->|𝛿| Z2
  F -->|𝑑| Z3
  A -->|𝑟| Z4
  B -->|𝑚₂| Z5
  classDef transition fill:#53b6b2
  classDef death fill:#ddd,color:#555
  class X0 transition
  class X1 transition
  class X2 death
  class X3 transition
  class X4 transition
  class Y1 transition
  class Y2 transition
  class Y3 transition
  class Z1 death
  class Z2 death
  class Z3 death
  class Z4 death
  class Z5 death
The meta-mistake
I often make errors in the process of turning the diagram into equations.